We already know the structure of wave file and thus we are able to read it byte by byte (actually we need to read the data chunk sample by sample). Now the next move is to get "fingerprints" from our files.
Fingerprint
A fingerprint can uniquely and compactly represent an audio file. It consists of several points of local energy maximum in audio spectral density. How the spectral density varies in time can be shown by a spectrogram. The most common format is a graph with two geometric dimensions: the horizontal axis represents time, the vertical axis is frequency; a third dimension indicating the amplitude of a particular frequency at a particular time is represented by the intensity or colour of each point in the image, e.g., the brighter the shade, the more energy is contained in the time-frequency point. The only thing we need is a amount of acoustic energy in predefined frequency and time.
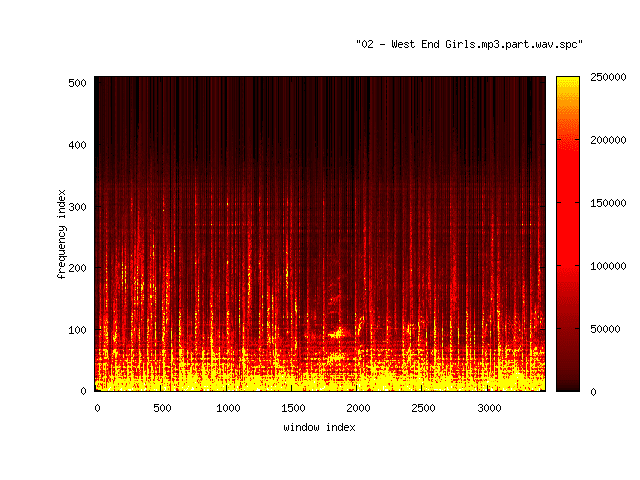
A spectrogram of 30 seconds of the part of Pet Shop Boys "West End Girls" song starting from 1:00
Spectrograms can be obtained by Short Time Fourier Transform. The audio samples are grouped into analysis time windows (preferably overlapping) wi of equal length N, with wi denoting the i-th window. For each window the Fourier transform is calculated, giving a complex vector vi = STFT(wi) of the same length as the window. Because in this case the input given to the Fourier transform always are vectors of real numbers, the output complex vectors obey the symmetry:
vi[q] == -vi[N-q+1]
So the complete information is contained in the first N/2 components of the complex vector vi.
The Fourier transform decomposes the signal given by the samples inside each input window in terms of sine waves of discrete frequencies. These frequencies are integer multiples of the fundamental frequency which is determined by the window length N and the sampling rate S of the waveform representation. The frequency Fk for a particular index k in the complex vector may be calculated by using the following formula:
Fk = k * S / N , where k = 0, ... ,N/2
The first frequency F0 is always zero. If we have a sampling rate of 44100 Hz and a window length of 1024 samples, the base frequency F1 is 43.0664 Hz and the maximum frequency F512 is the Nyquist rate 22050 Hz.
Then we need the absolute value for each component of vk to get a measure of how strongly a discrete frequency Fk is present in the decomposition of the i-th window of audio file. This data can then be used for plotting the spectrogram. When the spectrogram is plotted the fingerprint points are chosen to be points that are local maximum within regions of fixed size surrounding the point. Larger region size leads to fewer but possibly more significant points. The resulting features are saved as pairs of integer numbers (i, k) with i being the window index and k being the frequency index.
No comments:
Post a Comment